buffering parks

BUFFERS!

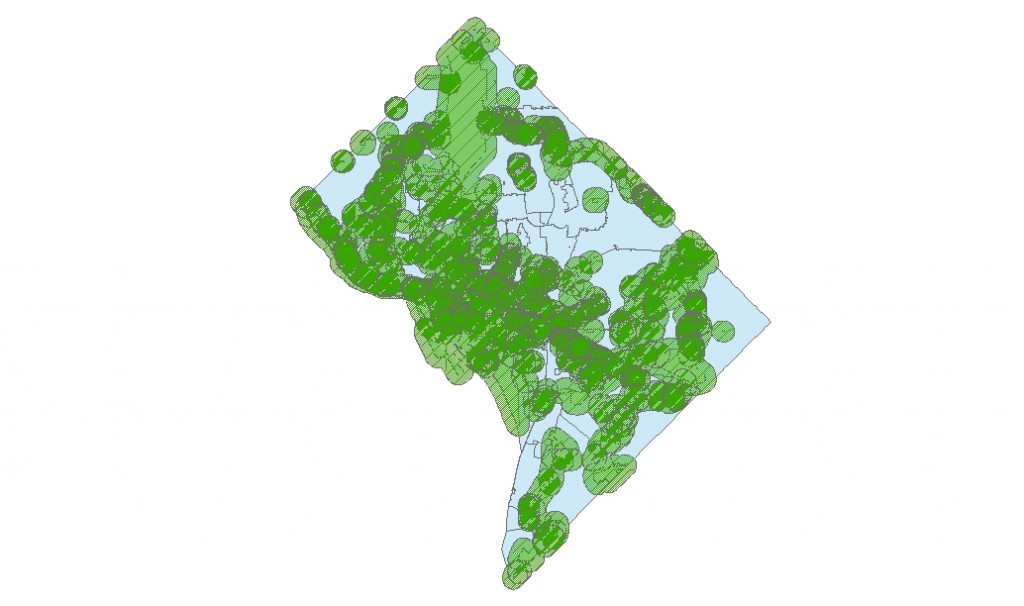
Since GIS is the theme for upcoming APHA conference, I am creating a map a day! Its quick, many map wont have detailed stuffs like legend and description, but depending on the time availability, I will be adding” layers to layers” 🙂 Here i created buffer (0.25 miles) around the parks in Washington DC. It beautifully explains how few regions do not have access to the park.

Danielle says,”Women are at more risk to be anemic if they live four quartermiles away from healthy food source.”

She also adds”We developed 5000 obstetric patients cohort that lived in Bronx New York and we used GIS to map the patients, through netwrok in Bronx. Through SOftware we calculated their distance to their healthy food source which was defined as supermarket.”

Danielle, MD candidate, is the first GiS graduate from Lehman College. And I believe that GiS has great future. I am trying to integrate GiS course from all colleges so that research ideas can be brought on single plateform. Thanks to Dr.Morako and Dr.Johnson, this program has bright future, and it could get competitive in coming year.

GIS-Hunter college http://www.geo.hunter.cuny.edu/programs/gis.html

GIS Lehman College http://www.lehman.edu/academics/eggs/geographic-information-science.php

GIS NYU http://nyu.libguides.com/GIS

GIS Baruch College http://guides.newman.baruch.cuny.edu/gis

J Urban Health. 2011 Oct;88(5):977-81. doi: 10.1007/s11524-011-9593-2.

Green Carts (mobile produce vendors) in the Bronx–optimally positioned to meet neighborhood fruit-and-vegetable needs?

Source

Department of Family and Social Medicine, Montefiore Medical Center/Albert Einstein College of Medicine, Bronx, NY, USA. slucan@yahoo.com

Abstract

Poor access to fresh produce likely contributes to disparities in obesity and diet-related diseases in the Bronx. New York City’s Green Cart program is a partial response to the problem. We evaluated this program (permitting street vendors to sell fresh produce) by canvassing the Bronx for carts, interviewing vendors, and analyzing their locations and food offerings. Green Carts were clustered in areas of probable high pedestrian traffic, covering only about 57% of needy areas by liberal estimates. Some carts sold outside allowed boundaries; a few sold sugary snacks. Vendor locations and their food offerings suggest possible areas for program improvement

The role of GIS in cancer epidemiology would be interesting.  The geographic pattern of cancer is so different. For example, nasopharyngeal carcinoma is common in Southern China. Recently I met Chinese girl from Henan province(northern part) . We had brief conversation on her province and health condition. I remembered, while reading epidemiology of  esophagus cancer, we had mentioning of Henan province. Probably, it has to do with p53 gene mutation, which is more common in indigenous population of Henan!


Just by clicking on  the add button (which is plus sign has reverse yellow triangle at base). By clicking on it, one can add the desired layer after browsing the files in computer.


Here we can change the order of layer, color of layer, outline  and width of the layer . It will be set.

I browsed this very useful data of cancer mortality from

http://ratecalc.cancer.gov/ratecalc/


This website I found very useful for cancer mortality. I can have data in excel forms. I can use it for various softwares , and even with GIS.

Incidence of Nasopharyngeal carcinoma is very high in Southern China and Northern Africa (Qui et al 2011). We can map epidemiological data with GiS. We can convert tabular tendencies into trends and beautiful maps. It goes well with government as well, because GiS is good at following administrative boundaries. Accurate mapping with GiS would help in identifying priority areas in light of prevention and treatment.As we travel from Southern China to north, incidence of NPC decreases. We can direct rediotherapy and chemotherapy or both together for patients according to need. On the basis of MAP LEGENDS, new cancer center, or chemotherapy center or reditherapy centyers can be started. Yesterday , I was following Malaysian news, and 71 year old nasopharyngeal cancer patient was turned down by hospital authority. So sad to know that (Daily Express , Malaysia2013).

Qiu C, Yang N, Tian G, Liu H. Weight loss during radiotherapy for nasopharyngeal carcinoma: a prospective study from northern China. Nutr Cancer. 2011;63(6):873-9.


     GiS for business 

What is GiS::: in my poor English I would say.. It is display of data beautifully in the form of map..it is the language of cartographer.

Now I will introduce you to data types in GiS:
1) attribute data ,which is for example in dBase file
2) map data which is in shape file(shp)

Types of map:  dot density map,thematic map, bivariate thematic map,

Projections:  Rbinson, Mercatur, Albers Conformal

Scale which I never try to understand during GiS course, but now after reading I got bit of it. It’s type of ai would say analogy. It is the ratio of distances of object represented on the map to the actual distances of those objects on the earth.

TIGER:  topologically integrated geographic encoding and referencing system

giS application in business:
Employee demographics
Strategic planning
Decision making

GiS for retail business:


Understand geography and study people’s relationship to location…

Take any basic map from census and add layers

GiS in retail business:
Integrate, view and analyze data.
Retail business constitute:  site selection, market analysis, distribution, delivery and management of facilities in relation to geography.

What is the beauty of GiS in light of retail business??

Companies are able to consider many possibilities
Companies can understand the potential,of investment in certain location,
Companies can analyze changing trends with GiS

Area of high demand
Area of high visual exposure

Any business to start, need to focus on three important factors..

1) operations: inside the wall of the business holding building.( customer service)
2) area surrounding
3) location: demographies, traffic counts, consumer demand, transport system etc

The new businessman comes with concept. In view of retails in mind, he thinks of chain. He might use quantitative methodology for concerned business.

Role of ArCGiS business analyst: he can help in comparing sites..

Correlation:  sales revenues as dependent variable.

Sometimes businessperson come with idea of opening the new site not far from existing site, example of cannibalization.

Gravity model??

Multiple regression analyst:
Of course , in business,  profit is dependent variable.
GiS can help in predicting the sales potential of prospective sites.

Time is the worst enemy of multiple regression model

ArcGIS  business analyst use community Tapestry to profile customers.
The term “choroplethe map” was introduced 1938 by the geographer John Wright in “Problems in Population Mapping”. (source, wikipedia). It is the communication between cartographer and audiences. It explains rates, densities and proportions, I think this is the point where GiS researchers and Epidemiologist have fun together 🙂

\Here right clicking on the layer, then properties ”general tab and ranming the layers help. One should be familiar with ‘insert’.

Already mentioned in previous post about attribute tables: we have to go to attributwe tables and then add field ..

New HIV cases per thousand population. New breast cancer cases per thousand population in the Queens.

Now i am really impressed with GiS software, how elegantly it gives histogram here…

How can we beautify map?  yes, give its color, give it new name…

How??


Go to the layer, and then to properties, symbology..quantities..bla bla bla.. you can see magic happening on the computer screen. You are giving new clothes to map…

Next Page »